TRANSFORM YOUR REPORTING AND ANALYTICS CAPABILITIES
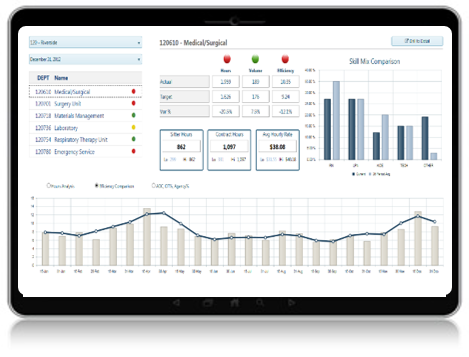
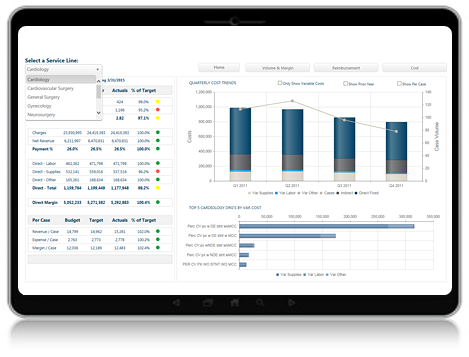
- Insightful Analysis. Gain important insight into all areas of the organization through drill-down/drill-through, ranking, trending and variance analyses that uncover root causes of performance
- Impactful Reporting. Present information with dashboards and data visualizations that inform executive decision making
- Automation and Collaboration. Complex report books can be generated and shared automatically with stakeholders using a variety of formats; a message stream feature allows users to capture dialog and commentary in the context of any document or process
- Security and Scalability. Enable end users ad hoc reporting and filter content using Axiom Software’s role-based security to ensure that only accurate, authorized information is delivered to each user type
ENTERPRISE DASHBOARDS
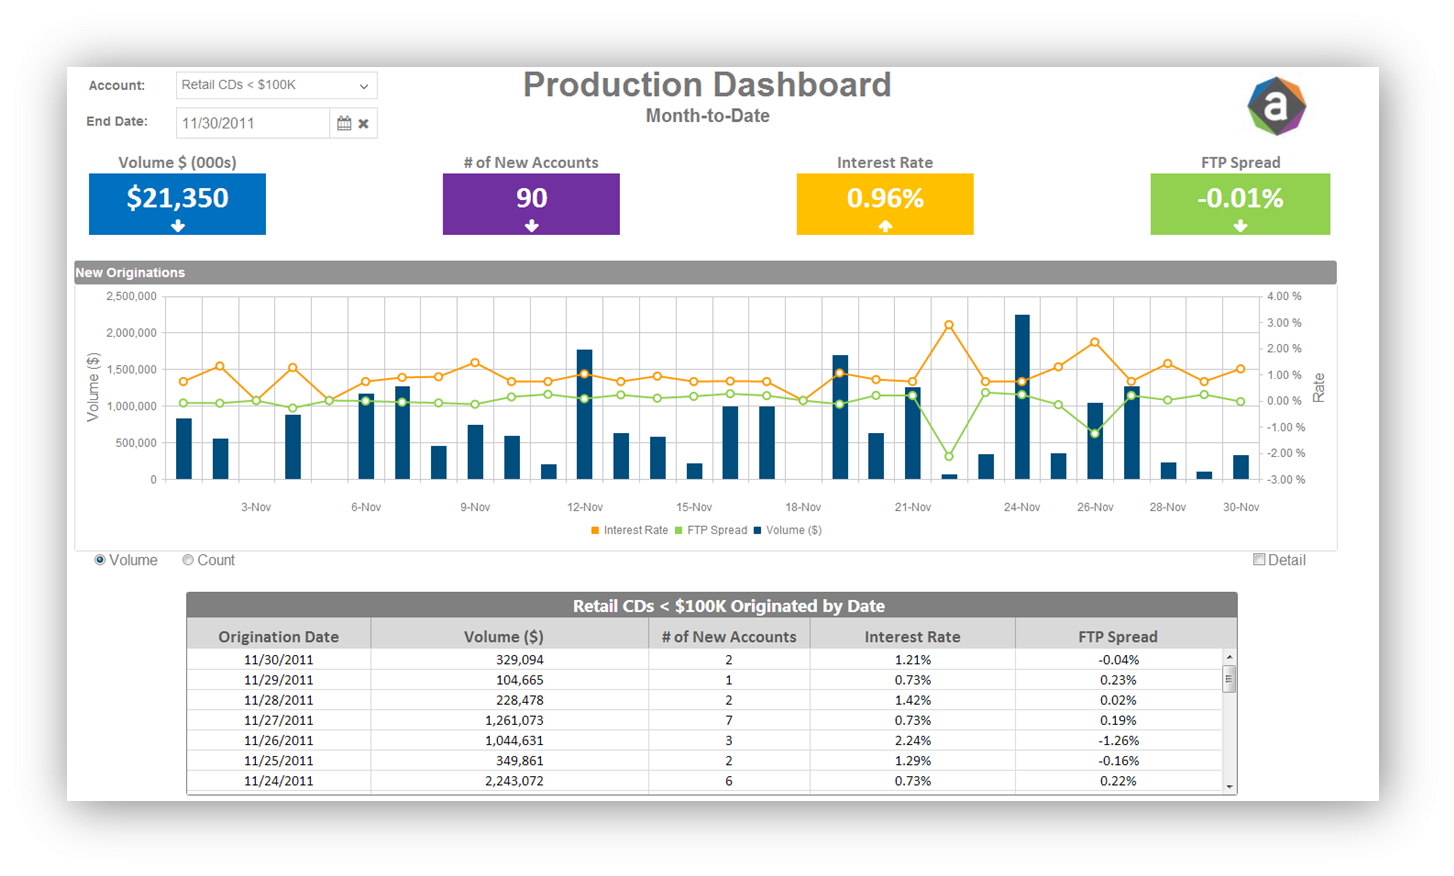
Axiom Software supports the creation of visually rich analytics combining financial and operational data, KPIs and other metrics. These dashboards respond in seconds — even for very large data sets and user communities. Report authors can leverage intuitive design tools to streamline report creation, apply data filters and apply formatting and visualization to any report.
ONE VERSION OF THE TRUTH
With an easy-to-use interface, Axiom Software can integrate any data source (financial, operational, CRM, etc.) and manage the metadata of those sources with common definitions (dimensional lists and hierarchies, historical data retention rules, key ratio definitions, etc.) to ensure data quality standards are adhered to. Rollup Structures and “on-the-fly” dimension updating are easily managed as well. You can be assured that the easily created dashboards are using trusted, validated data stored within the Axiom platform.
PRESENTATION READY
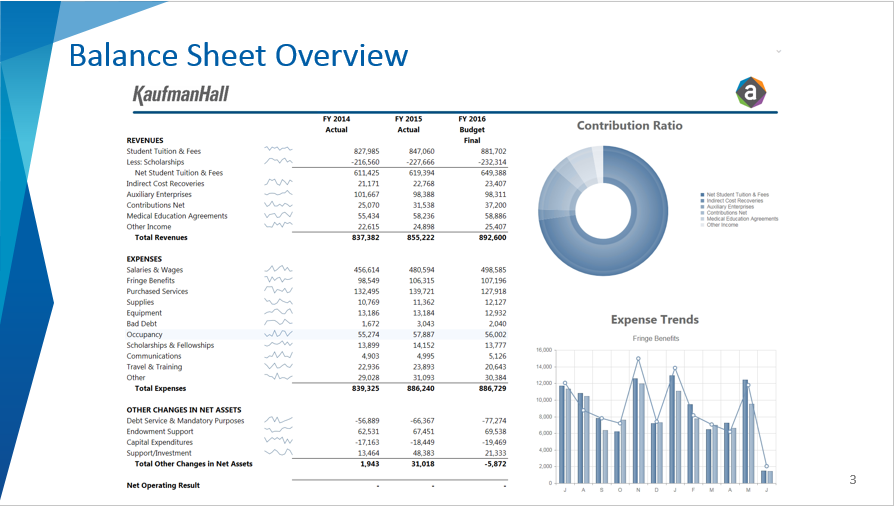
Axiom Software enables users to communicate financial results, trends and analysis to the board and other organizational stakeholders by quickly and easily integrating Axiom analytics within a PowerPoint presentation. This integration allows for either directly connected, fully interactive analytics or disconnected snapshots that can be refreshed directly within PowerPoint.
ANY USER, ANY PLATFORM, ANY DEVICE
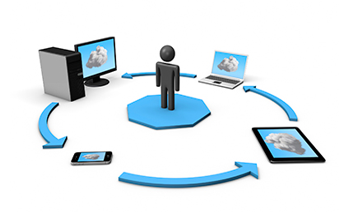
Axiom Dashboards can be rendered directly into the Axiom platform, on Macs or PCs, in any web browser or on any mobile device. Mobile dashboards make critical performance information available anytime, anywhere enabling business users to interact with reports, spot trends, conduct ad hoc analysis and make timely, informed decisions regardless of location. End users require only a browser to view dashboards and there is no software install.
