REPORTING & ANALYTICS

Dashboards

Axiom Software dashboards provide unprecedented visualizations of financial performance data, KPIs, operational metrics, rankings, relative contribution, trends, variances, and outliers to project a complete picture of organizational performance.

TRANSFORMING DATA INTO INSIGHT
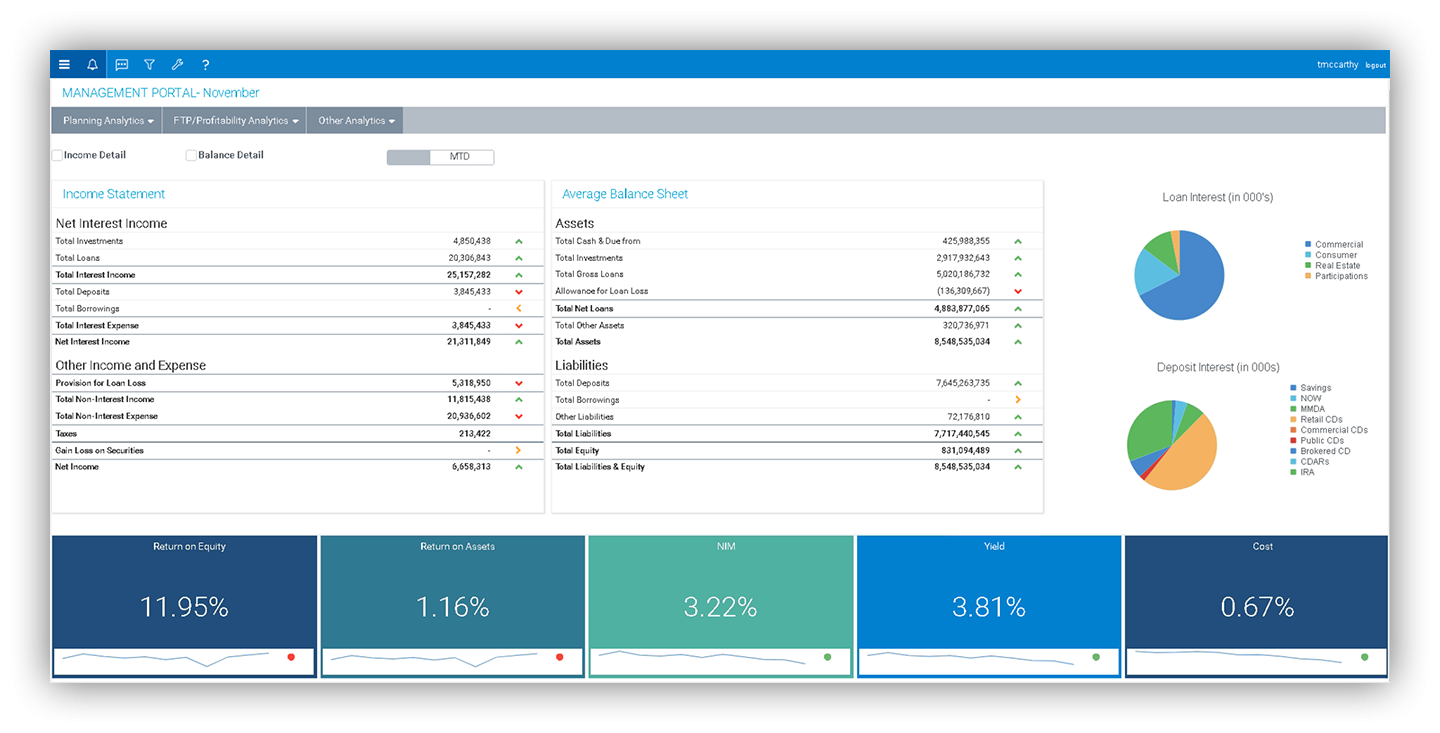
  • Display key performance indicators (KPIs) leveraging data definitions already established in the Axiom Software platform
  • Leverage robust visualization components and “drag & drop” functionality to design and publish dashboards quickly based on end user preferences
  • Drill down and through to source reports to analyze the root cause details behind alerts and variances
  • Communicate results, trends and analysis to key stakeholders by embedding Axiom reports and dashboards within PowerPoint® presentations
  • Input changes directly to the dashboard and write-back to the Axiom Software platform in real-time to update plans and facilitate workflow
  • Render dashboards easily within the Axiom Software platform, on a Mac or a PC, in any web browser or on any mobile device, including tablets and smartphones
  • Define user access and permissions with role-based security


WHY AXIOM SOFTWARE?

The optimized database structure of the Axiom Software platform supports the creation of visually rich analytics combining financial and operational data, KPIs and other metrics. These dashboards respond in seconds — even for very large data sets and user communities. The platform can grow and scale based on the needs of the organization. To ensure proper controls over confidential data, dashboards leverage the same user access and role-based security that governs all user interactions.


Discover Our Software

Request a software demonstration and see how to improve organizational performance.

Talk to an Expert

Talk to an expert to discuss performance improvement opportunities in your organization.